Let’s reconfirm the basic knowledge about spectrum analyzers.
Application
A spectrum analyzer is a highly sensitive measuring instrument that displays AC power by frequency. It may be damaged by static electricity / DC power input or AC power excessive input, or the result may be displayed inaccurately.
In addition, there are many setting conditions for measurement, and the measurement results may differ if the setting conditions are changed.
I think there are engineers who are not good at these things, so let’s reconfirm the basic knowledge of spectrum analyzers.
Types of spectrum analyzer
Spectrum analyzers have two different measurement principles. It is a sweep method using superheterodyne technology and a real-time method by fast Fourier transform (FFT).
The sweep method is a tuned sweep technology that cuts out and amplifies only specific frequency components. The input signal is converted to IF (intermediate frequency) using a mixer (mixer) and LO (local oscillator). Converts to IF while automatically sweeping the frequency with LO, the power value that has passed through the narrow band IF filter (this is the RBW) is displayed on the screen. The noise floor (display average noise level) is lowered by truncating the frequencies other than the targeted frequency components.
It is the same until conversion to one real-time IF, but after A / D (analog / digital) conversion of IF output, FFT (fast Fourier transform) calculation is performed, the power values of multiple frequency components are displayed simultaneously in the resolution bandwidth of RBW. Unlike the sweep method, it is not necessary to sweep the LO over time in the narrow band of RBW, so the measurement speed becomes faster.
Spectrum analyzer screen display
Each frequency component contained in the measured AC power is displayed as frequency on the horizontal axis and amplitude magnitude on the vertical axis of the screen.
The result display is in dB (decibel) log (logarithmic) units. The reason is that a wide dynamic range is required to display a large signal such as a carrier signal and a minute signal such as noise at the same time.
For example, suppose the vertical axis is set to display from -100 dB to 0 dB. The maximum / minimum ratio of the voltage value that can be displayed here is 100 dB = 100,000 times. By the way, when converted to a linear voltage, it is 2.24 μV to 224 mV. (50Ω system / voltage 20log calculation)
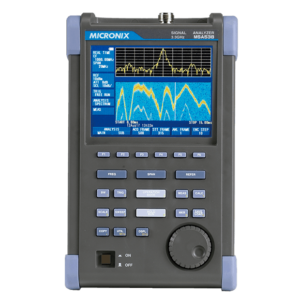
■MSA538 display screen
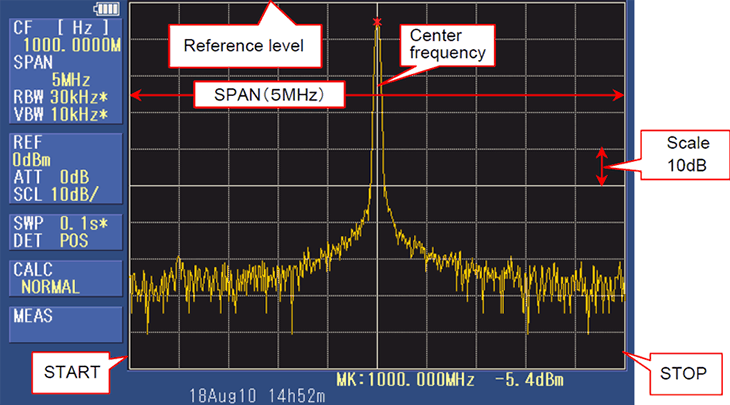
Main setting items of spectrum analyzer
Center frequency (CF), frequency width (SPAN), reference level (reference level), resolution bandwidth (RBW), video bandwidth (VBW) Amplitude setting (dBm, dBμV, dBμV / m, etc.) Detection mode (peak) There are many typical ones such as value, quasi-peak value, average), calculation function (maximum, minimum, average), etc., and it is considered to be one of the causes that engineers are not good at.
Solution
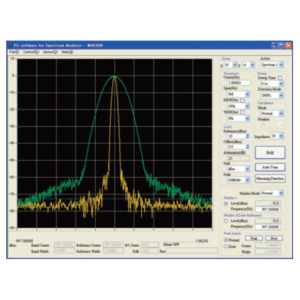
The MSA500 series signal analyzer solves the above problems. First, when you press the “AUTO TUNE” key in sweep mode, the maximum level signal in the measurable frequency band is automatically searched with the optimization settings.
Once you have searched for the maximum signal level, you can then perform a detailed analysis of the signal in real-time mode.
This is made possible by incorporating the two functions of sweep mode and real-time mode, which are the greatest features of the MSA500 series, into a single handheld signal analyzer. Therefore, it can be said that it is the best product to improve the awareness of weakness.
Spectrum Analyzer Basics (2) About RBW (resolution bandwidth)
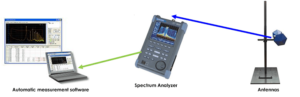
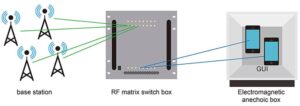
System configuration
Configuration example
| Handheld signal analyzer MSA538 |
| PC Software MAS500 |
| Other(Various cables, adapters, etc.)*Please contact us |
Products introduction

Please feel free to contact us.
If you want to verify 5G, customize a radio wave shield box, or need product repair, please do not hesitate to contact us about any small matter.